Which rooftops can hold solar?
A drone-photogrammetry survey of the TUM Roggenstein test site — reconstructing three buildings from UAV imagery into centimetre-scale 3D point clouds, then reading each rooftop's slope, orientation and sunlight to map exactly where solar panels would pay off.
A rooftop is only worth panelling if the geometry agrees
Rooftop solar lives or dies on three numbers: how much usable area a roof has, how steeply and which way it faces, and how much sunlight that orientation actually receives. Read them wrong and a feasibility study recommends panels for a north-facing pitch, or overstates the array a roof can hold. Desk estimates from cadastral outlines cannot see the real surface — the dormers, the parapets, the shaded valleys.
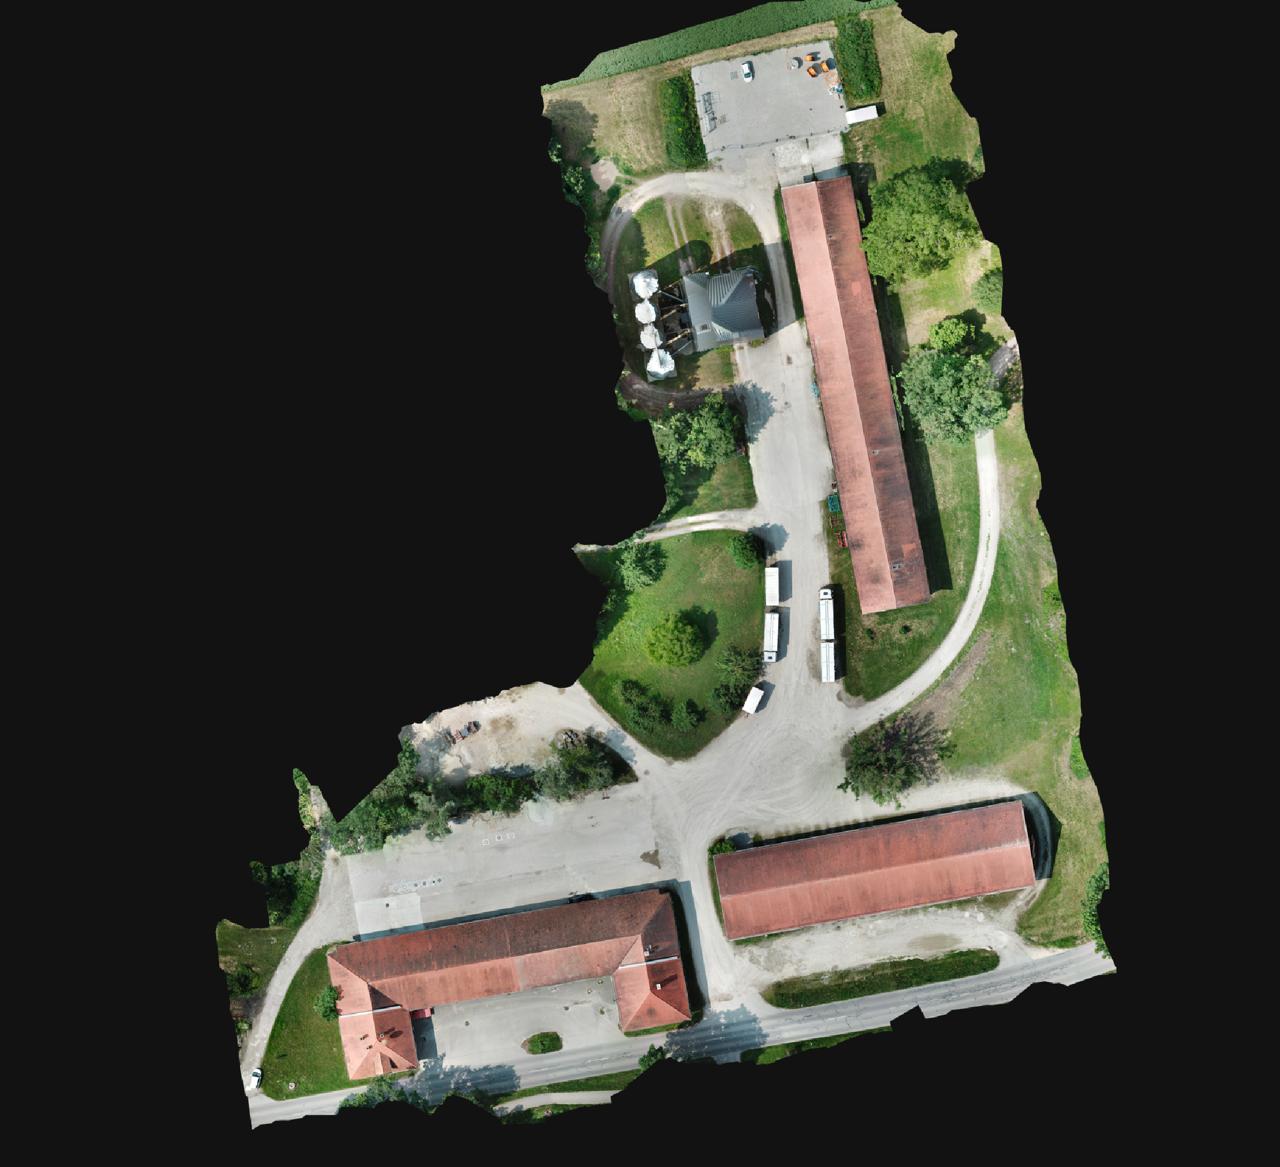
The brief was to measure those numbers directly from the building itself. Across the TUM Roggenstein test site, three structures had to be captured precisely enough to calculate rooftop areas, model their form in 3D, and decide — surface by surface — which parts could carry a productive solar array.
The roof, not the map, is the ground truth. Everything downstream depends on capturing it accurately first.
Three flights, planned like a survey
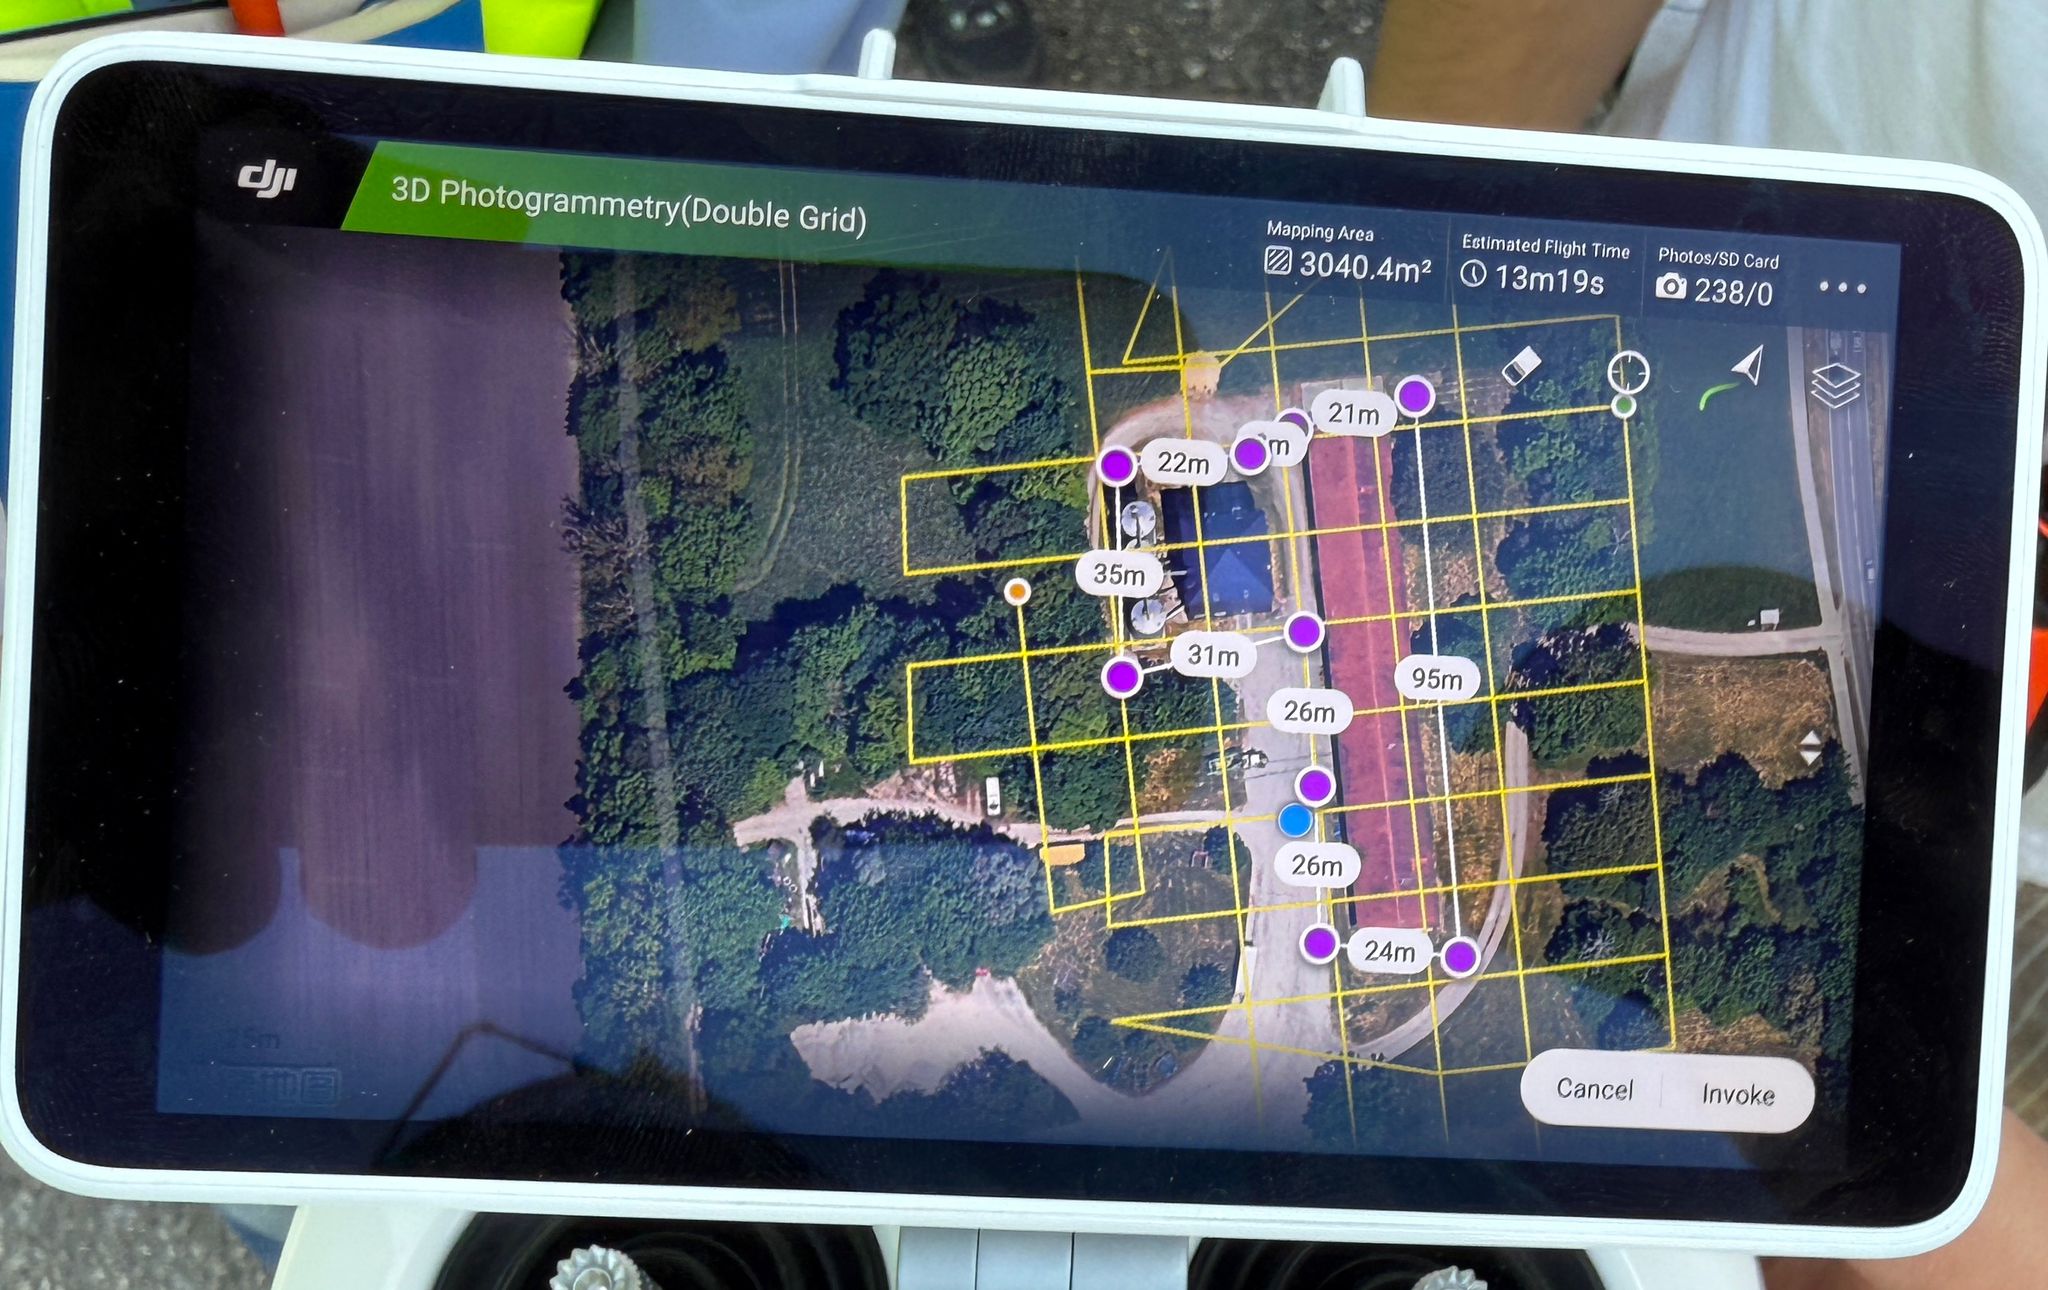
Capture followed deliberate mission planning rather than an opportunistic overflight. Three UAV flights — one per building — ran a nadir grid pattern at 50–80 m altitude, holding a steady 3–5 m/s to suppress motion blur and maintaining 80–90% forward and side image overlap so every rooftop feature appeared in many frames. The camera was tilted to an 80° oblique to capture façades and roof edges alongside the nadir shots, and an RTK-GNSS drone fixed each exposure to centimetre-level position, backed by four ground control points for georeferencing.
- 01 · ACQUIRE
Fly the grid
Three UAV flights, nadir + 80° oblique, 80–90% overlap, RTK-GNSS positioning with 4 GCPs.
- 02 · RECONSTRUCT
Build the cloud
Pix4Dmatic SfM ties the images into a sparse cloud, then MVS densifies to full rooftop geometry.
- 03 · MODEL
Surface & outlines
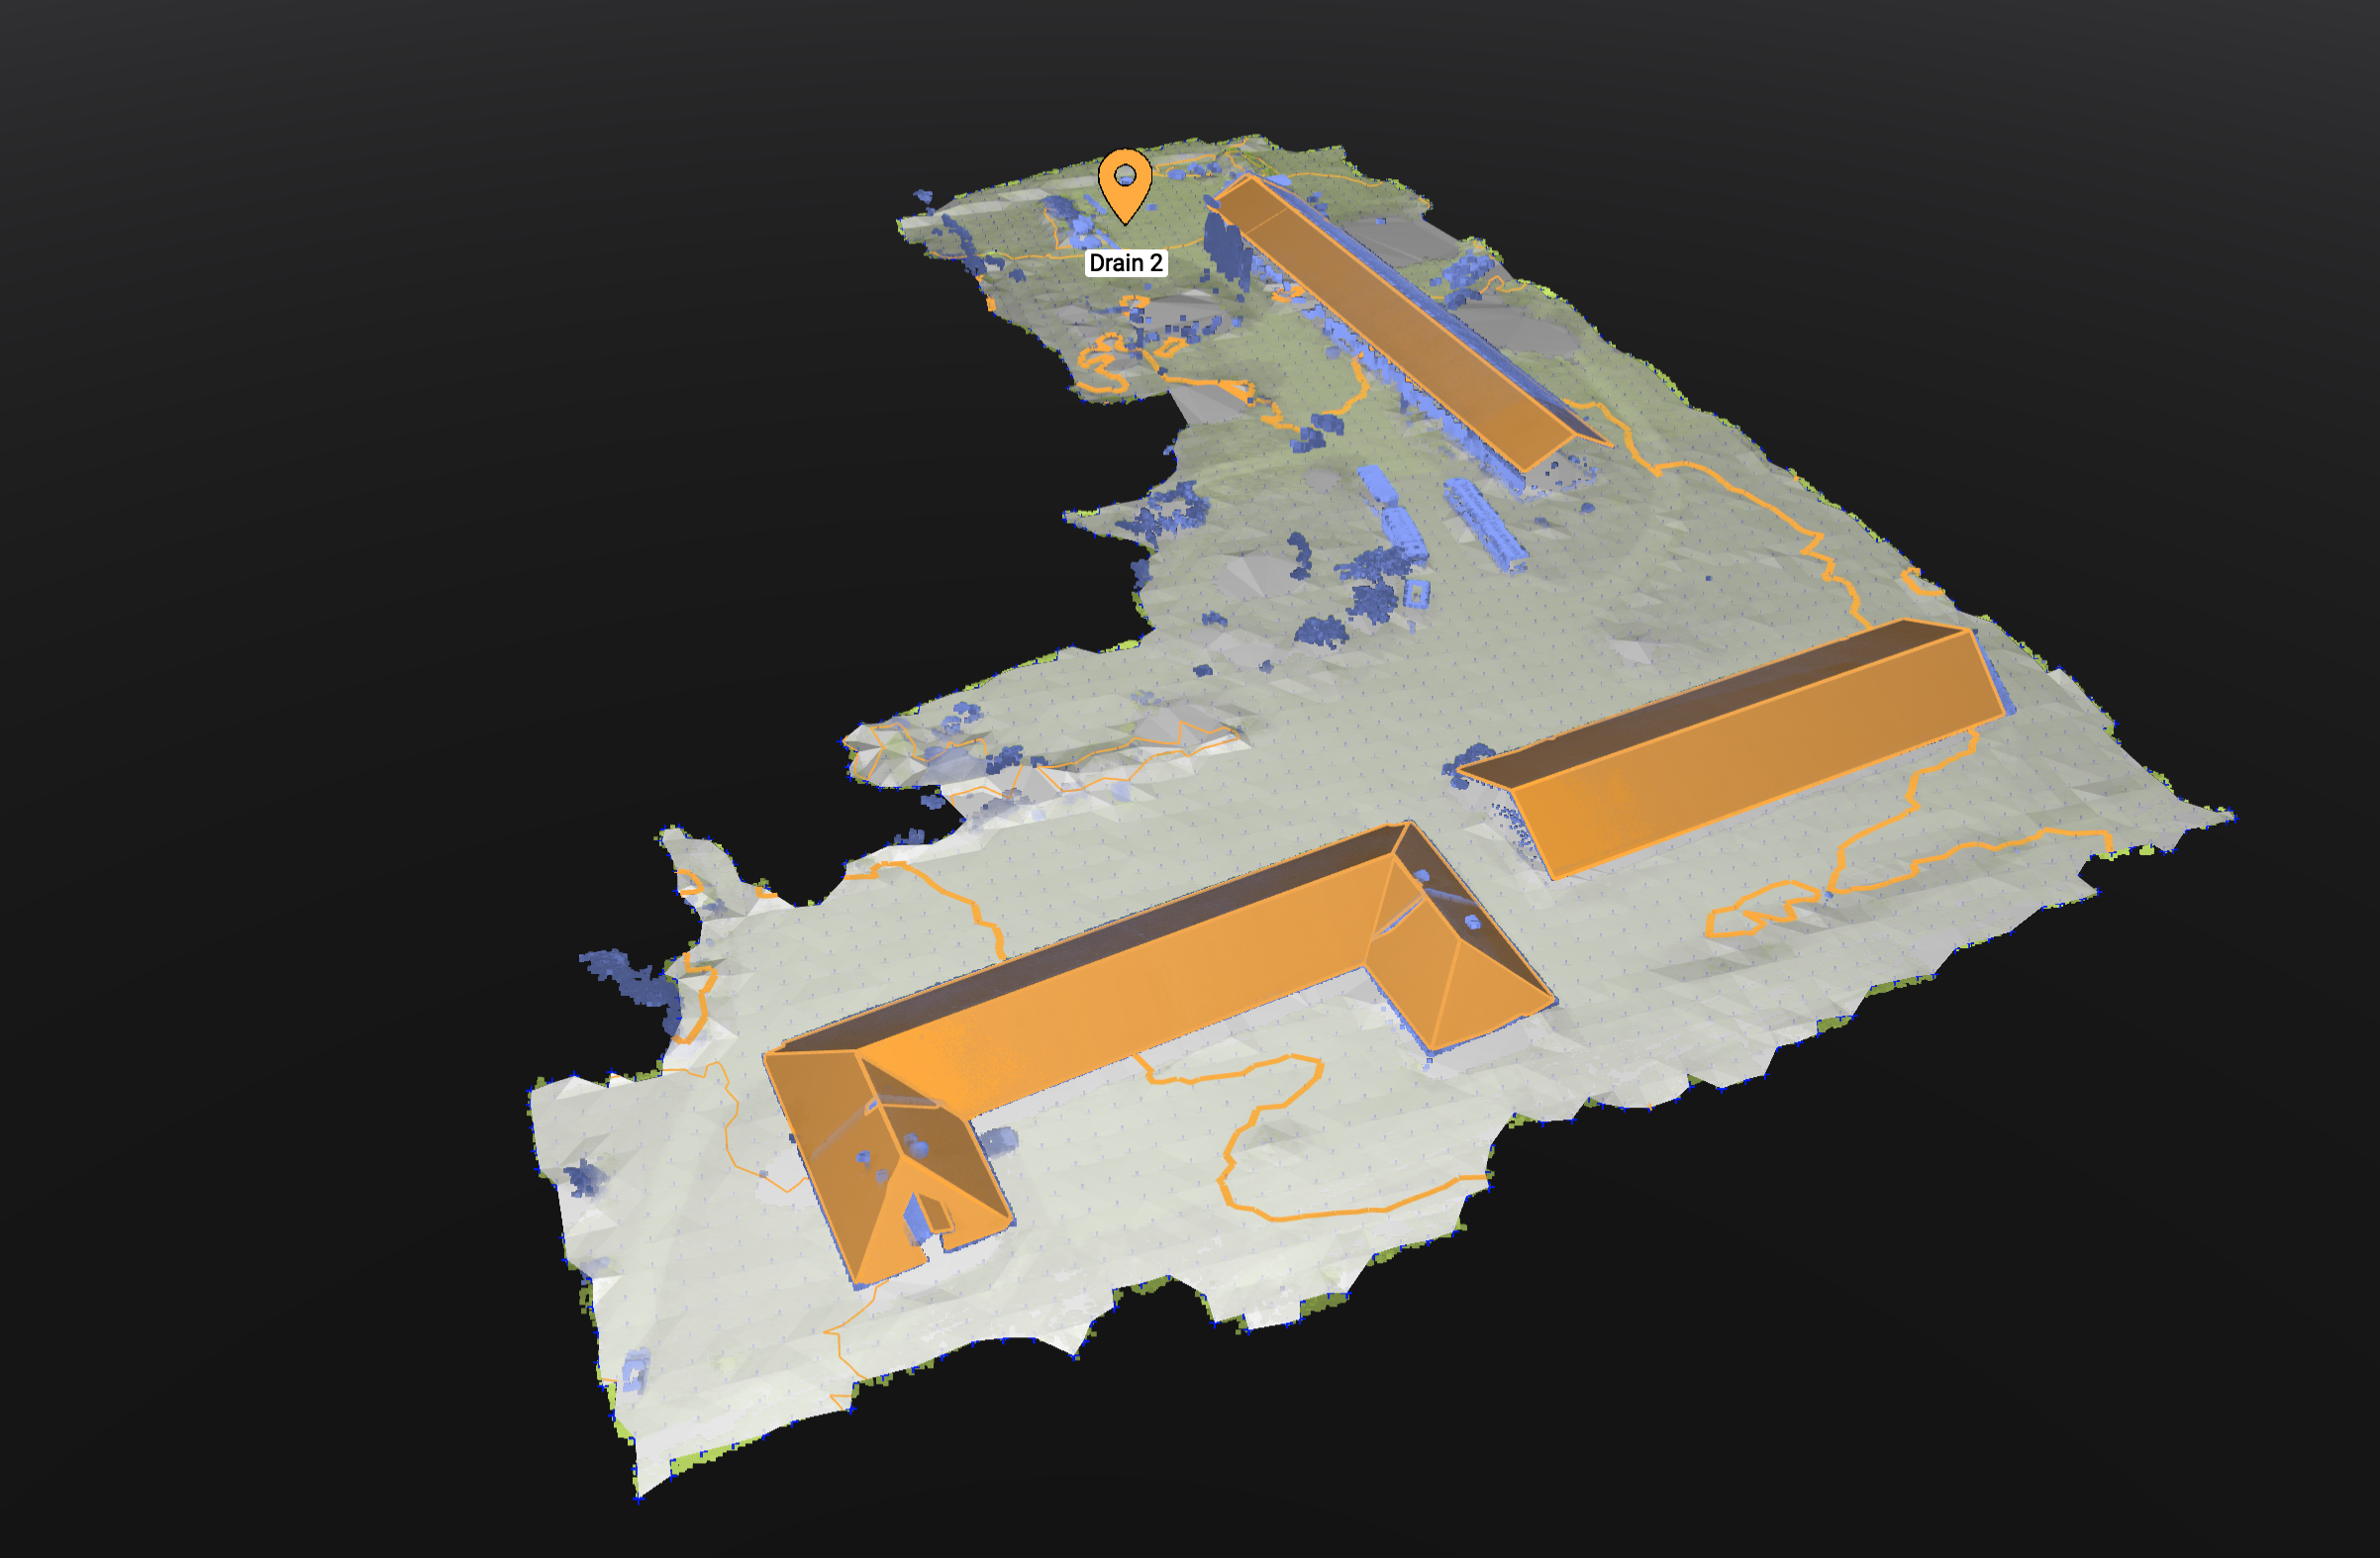
DSM and DTM from the ground-classified cloud; rooftop footprints extracted and cleaned.
- 04 · ASSESS
Score for solar
Slope/aspect mask, minimum-area filter and PVGIS irradiance drive a realistic energy estimate.
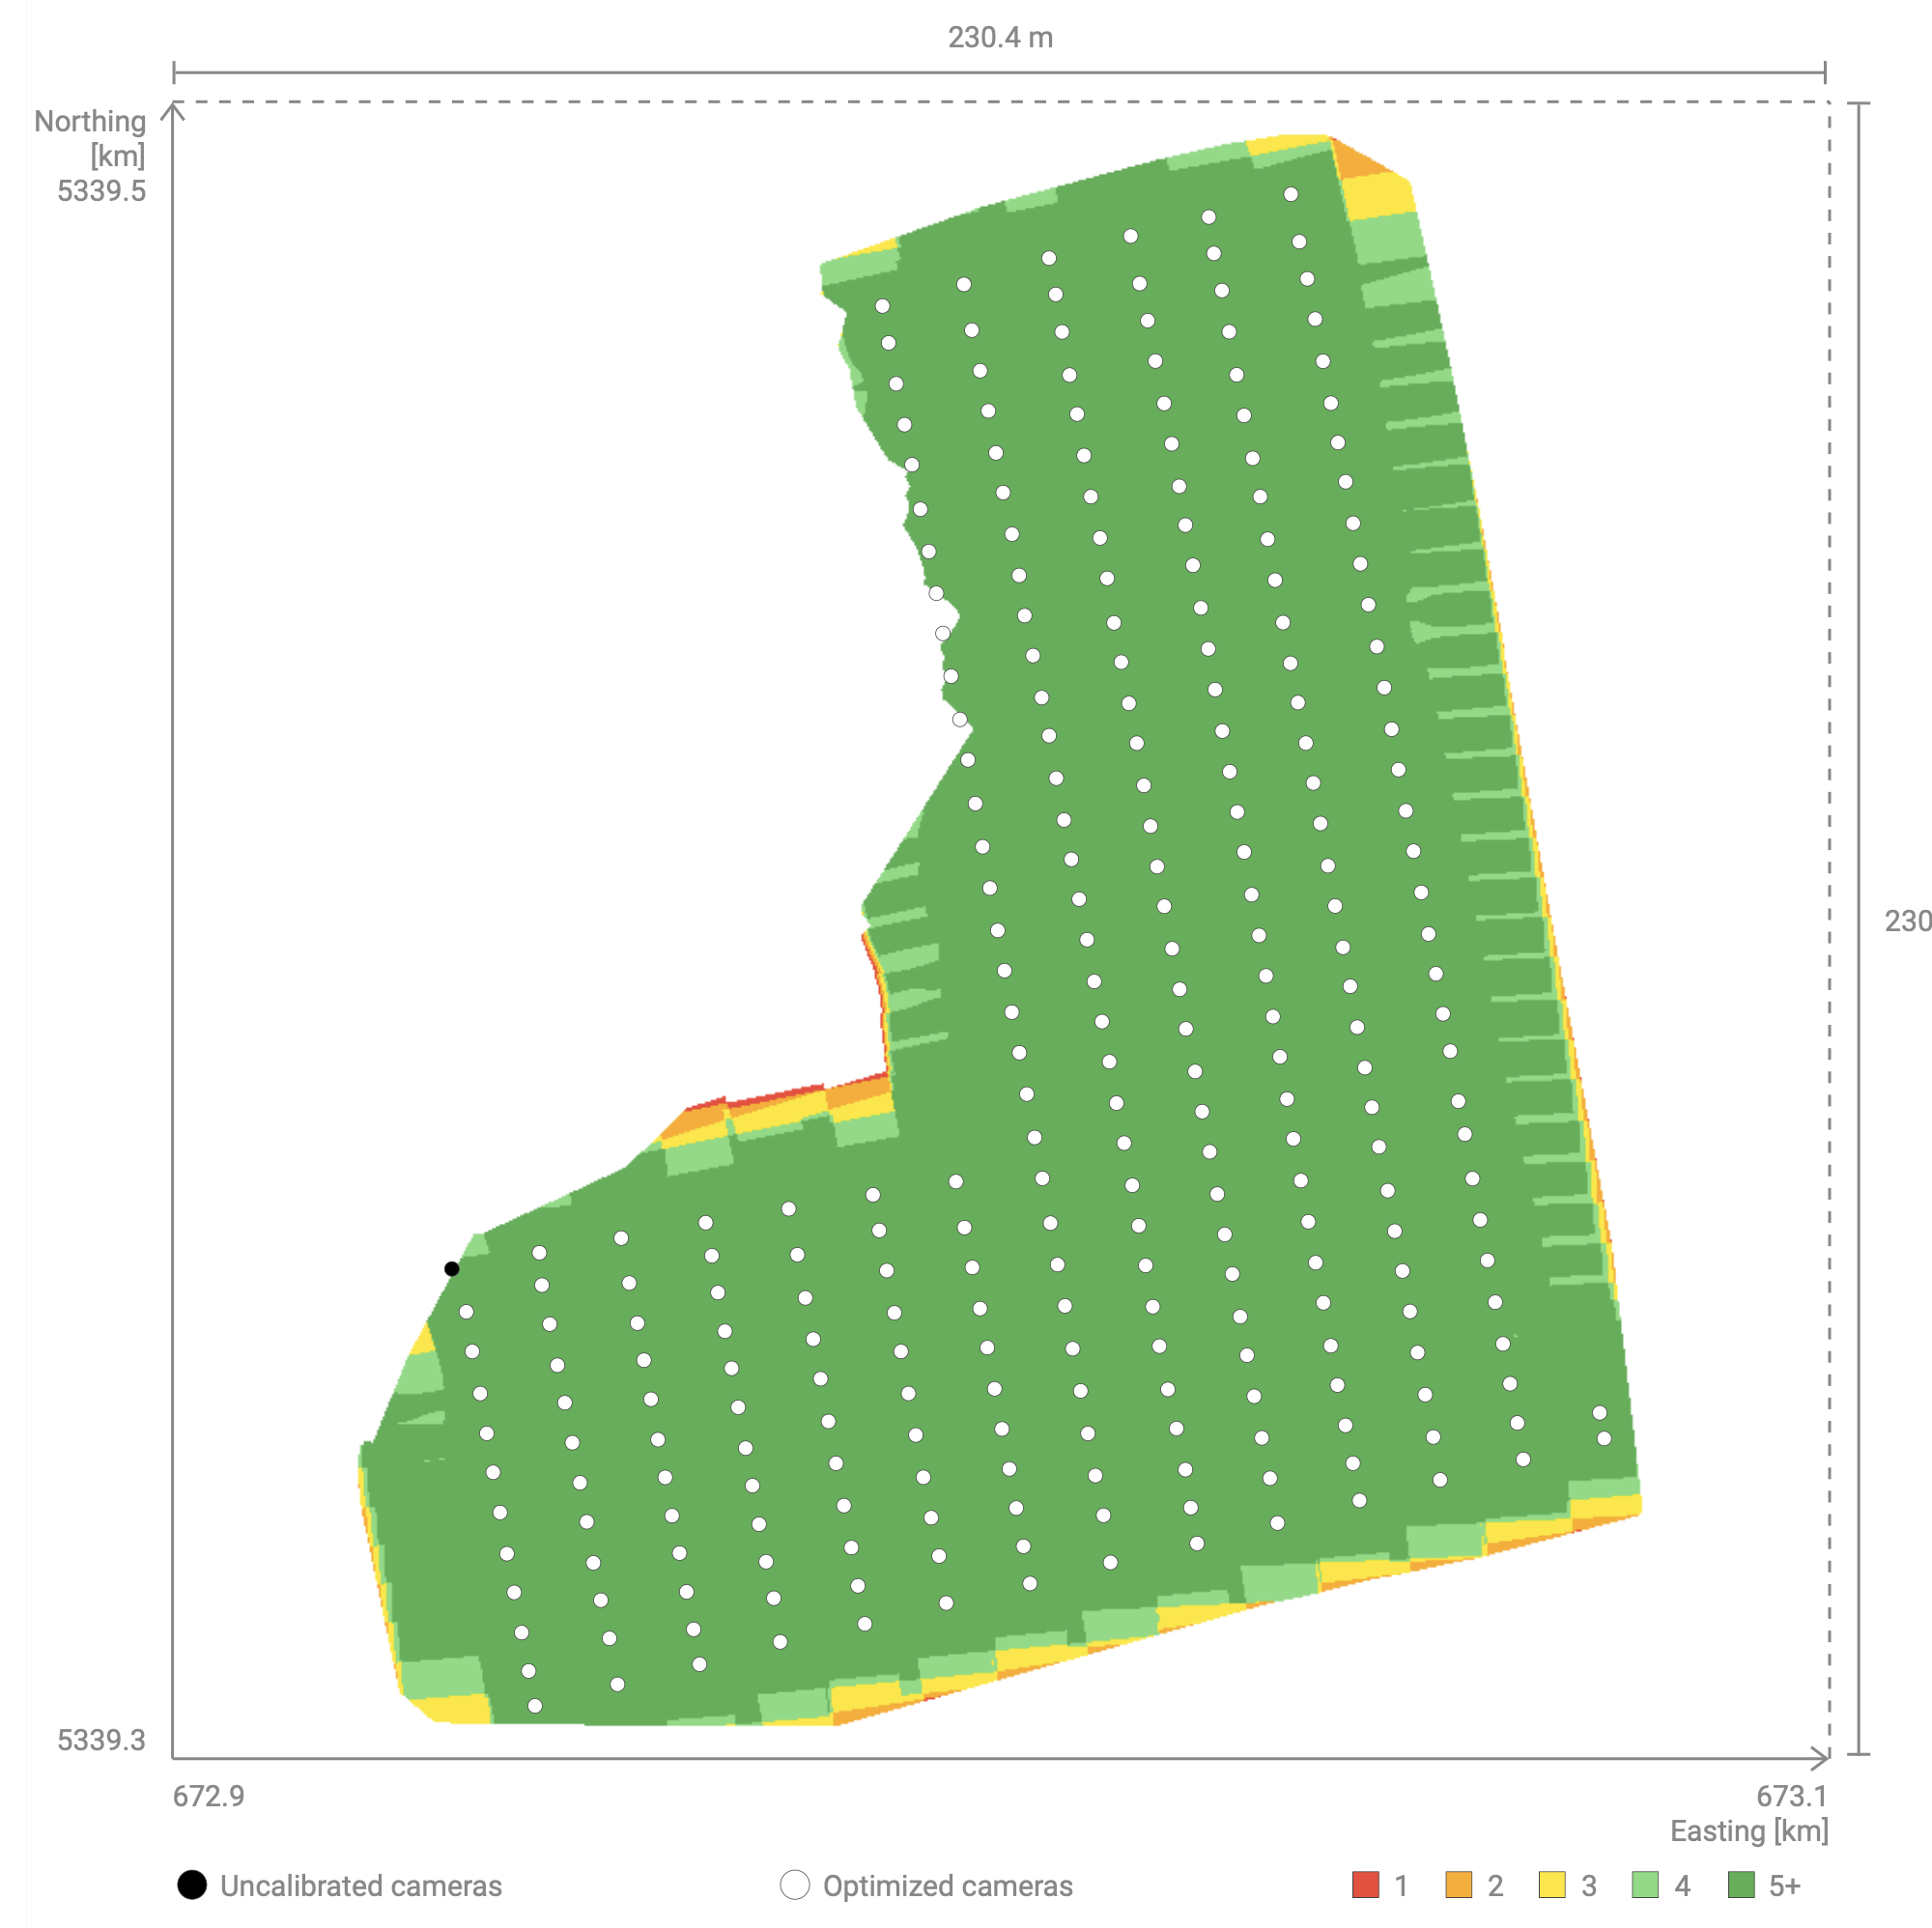
From overlapping photos to a dense 3D cloud
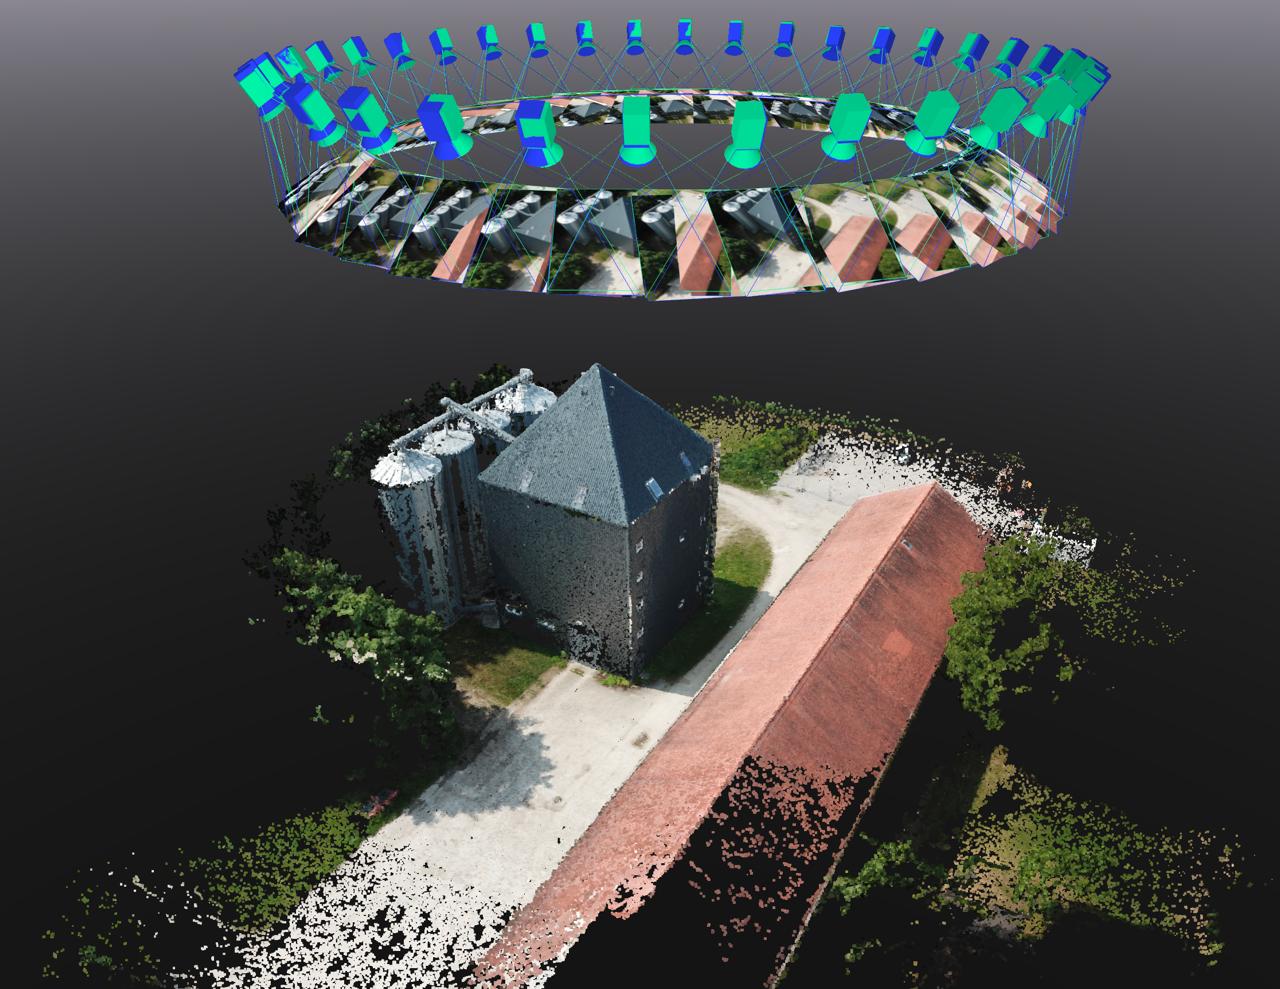
Reconstruction ran in Pix4Dmatic using Structure-from-Motion and Multi-View Stereo. Feature detection found keypoints — rooftop corners, edges, texture — and matched them across overlapping frames; bundle adjustment then solved the 3D positions and camera poses into a sparse cloud. Multi-View Stereo densified that skeleton into a detailed surface by computing depth from parallax across many views, resolving rooftop edges sharply while noise filters trimmed outliers. The known weakness showed where expected: smooth, low-texture metal roofs gave the matcher little to lock onto, adding noise that post-processing had to clean.
- DJI Phantom 4 RTK CAPTURE · RTK
- RTK-GNSS UAV for centimetre-referenced imagery — the precision benchmark dataset.
- DJI Mavic CAPTURE · STD
- Standard UAV dataset, compared against the RTK reference.
- Pix4Dmatic RECONSTRUCTION
- SfM + MVS point-cloud generation from the gridded image sets.
- CloudCompare SEGMENTATION
- Point-cloud segmentation, ground classification and DTM generation.
- PVGIS IRRADIANCE
- Photovoltaic Geographical Information System — annual irradiance input.
- Python · QGIS MODEL · VALIDATE
- Raster processing and energy modelling; spatial validation and visualisation.
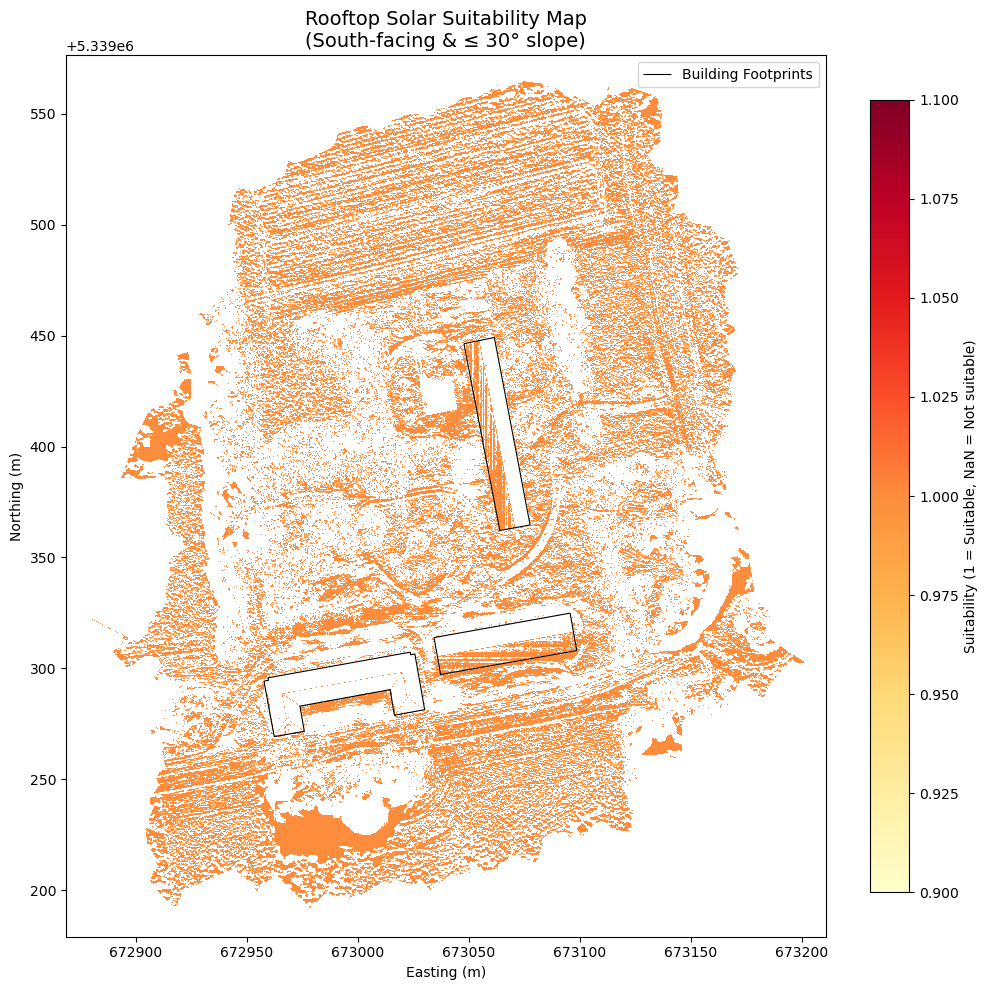
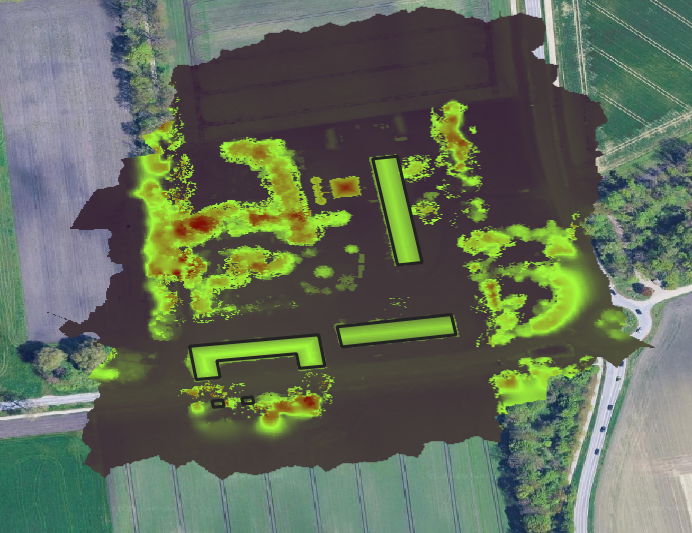
Reading the roof for sunlight
With surfaces reconstructed, the solar assessment moved into CloudCompare and Python. A digital surface model and digital terrain model were derived from the ground-classified cloud, and rooftop outlines extracted and cleaned. Each surface was then scored against physical suitability criteria — slope no greater than 30°, and a south-facing aspect between 90° and 270° — using a Sobel filter to compute slope and aspect from the raster. A minimum-area filter discarded fragments below 5 m², leaving only patches large enough to panel.
Turning area into energy
Suitable area was converted to expected yield with a transparent energy model — annual energy as irradiance times module efficiency times area times performance ratio (E = G·r·A·PR). PVGIS supplied a site irradiance of 1478.2 kWh/m²/year; module efficiency was taken at r = 0.18 and the system performance ratio at PR = 0.72, giving a realistic rather than nameplate estimate for each qualifying rooftop.
What the survey established
Comparing the two datasets isolated a clean, consistent 70 cm offset between the RTK-referenced Phantom 4 and the standard Mavic — useful precisely because it was predictable. Beyond that offset, both datasets proved highly effective for rooftop measurement, supporting accurate area calculation and detailed 3D modelling. Generating rooftop areas and models for solar assessment raised real processing and alignment challenges, but the workflow resolved them and delivered actionable per-roof suitability.
The campaign made the case for RTK precision in environmental work — minimising error where it matters — while showing that even a standard UAV dataset, handled carefully, can support sustainable-energy planning.
Where it goes next
- 01
Altitude vs. area error
Quantify how flight altitude trades ground resolution against rooftop-area accuracy for solar planning.
- 02
ArcGIS solar integration
Push the cleaned clouds into ArcGIS solar tooling for full irradiance modelling across the year.
- 03
Noise on low-texture roofs
Tighten reconstruction on smooth metal surfaces where keypoints — and therefore geometry — are scarce.
- 04
Scale the mission
Extend the repeatable workflow from three buildings to whole sites and campuses.
The study lays an end-to-end path — from flight plan to per-roof energy estimate — that turns a drone survey into a defensible solar-siting decision.
Sources & data
This case study is a condensed summary of independent research. For full data sources, datasets and references, please get in touch.
Need a survey that decisions can stand on?
If you are siting solar, measuring assets or mapping a site from the air, tell us the structures and what the survey has to prove — and we will plan the flights and the analysis around it.